In the next few weeks, we’ll be sharing a series of posts focused on the Rockefeller Archive Center’s archival records digitization services. In 2021-2022, our institution experienced a substantial increase in researcher digitization requests during reading room closures and diminished travel due to COVID-19, and we know we are not alone in experiencing shifting research patterns and request volume since the pandemic. So with the goal of sharing how we are reevaluating our digitization processes to better meet the demands of remote research support, this post will kick off the series with a look at how we used service design methodologies to holistically analyze our digitization workflows, systems, equipment, documentation, supporting policies, and the points of communication between them with the goal of identifying friction points and generating ideas for improvement based on that analysis.
Digitization of archival records at scale is an inherently complicated process. At the RAC, this work includes both outsourced digitization projects for large chunks of material and/or formats requiring equipment we don’t have, and ongoing in-house digitization in smaller chunks of images and textual records that is primarily driven by researcher requests. When researcher requests increased at the height of COVID, the growing backlog of in-house digitization prompted us to look more closely at our processes to improve efficiency. The increased demand drew our attention to the pieces of our processes that were not serving us: legacy project management systems that did not match our current workflows, a by-page fee model that likely offset cost recovery by adding extensive administrative labor, digital surrogate file-naming and organization that necessitated time-intensive and error-prone labor, lack of documentation contributing to a range of often-conflicting approaches and understandings about the work, and multiple hand-off touchpoints that slowed momentum and revealed communication gaps. There is no shame in admitting these problems. Processeses require maintenance and archival debt is real. We can find ways to forgive that debt and ourselves, ground our work in our mission and values, and keep trying to improve how we do our work for the benefit of our users. And to be clear: our users are not only external users, but also our RAC colleagues doing digitization work.
Don’t solve the problem before you understand what the problem is
When initially faced with a large and growing backlog of researcher digitization requests, it was tempting to just throw more resources at the backlog. Can we purchase more equipment? Can we allocate more staff time toward digitization? These are “solutions” to a problem that we didn’t understand. This is where our user experience (UX) research program and service design methodologies became useful. Taking the time to research and identify the problems allowed us to be strategic about solutions, and not introduce more future debt for ourselves.
What is service design?
If traditional UX design is focused on the experience of using specific apps, websites, and tools, service design steps back to look holistically at the choreography of process, communication, and infrastructure from a human-centered perspective to improve the “service” experience for all participants. It helps us think sequentially, visualize processes and their flow from one point to another so that participants understand their role, and be co-creative in making improvements with participants.
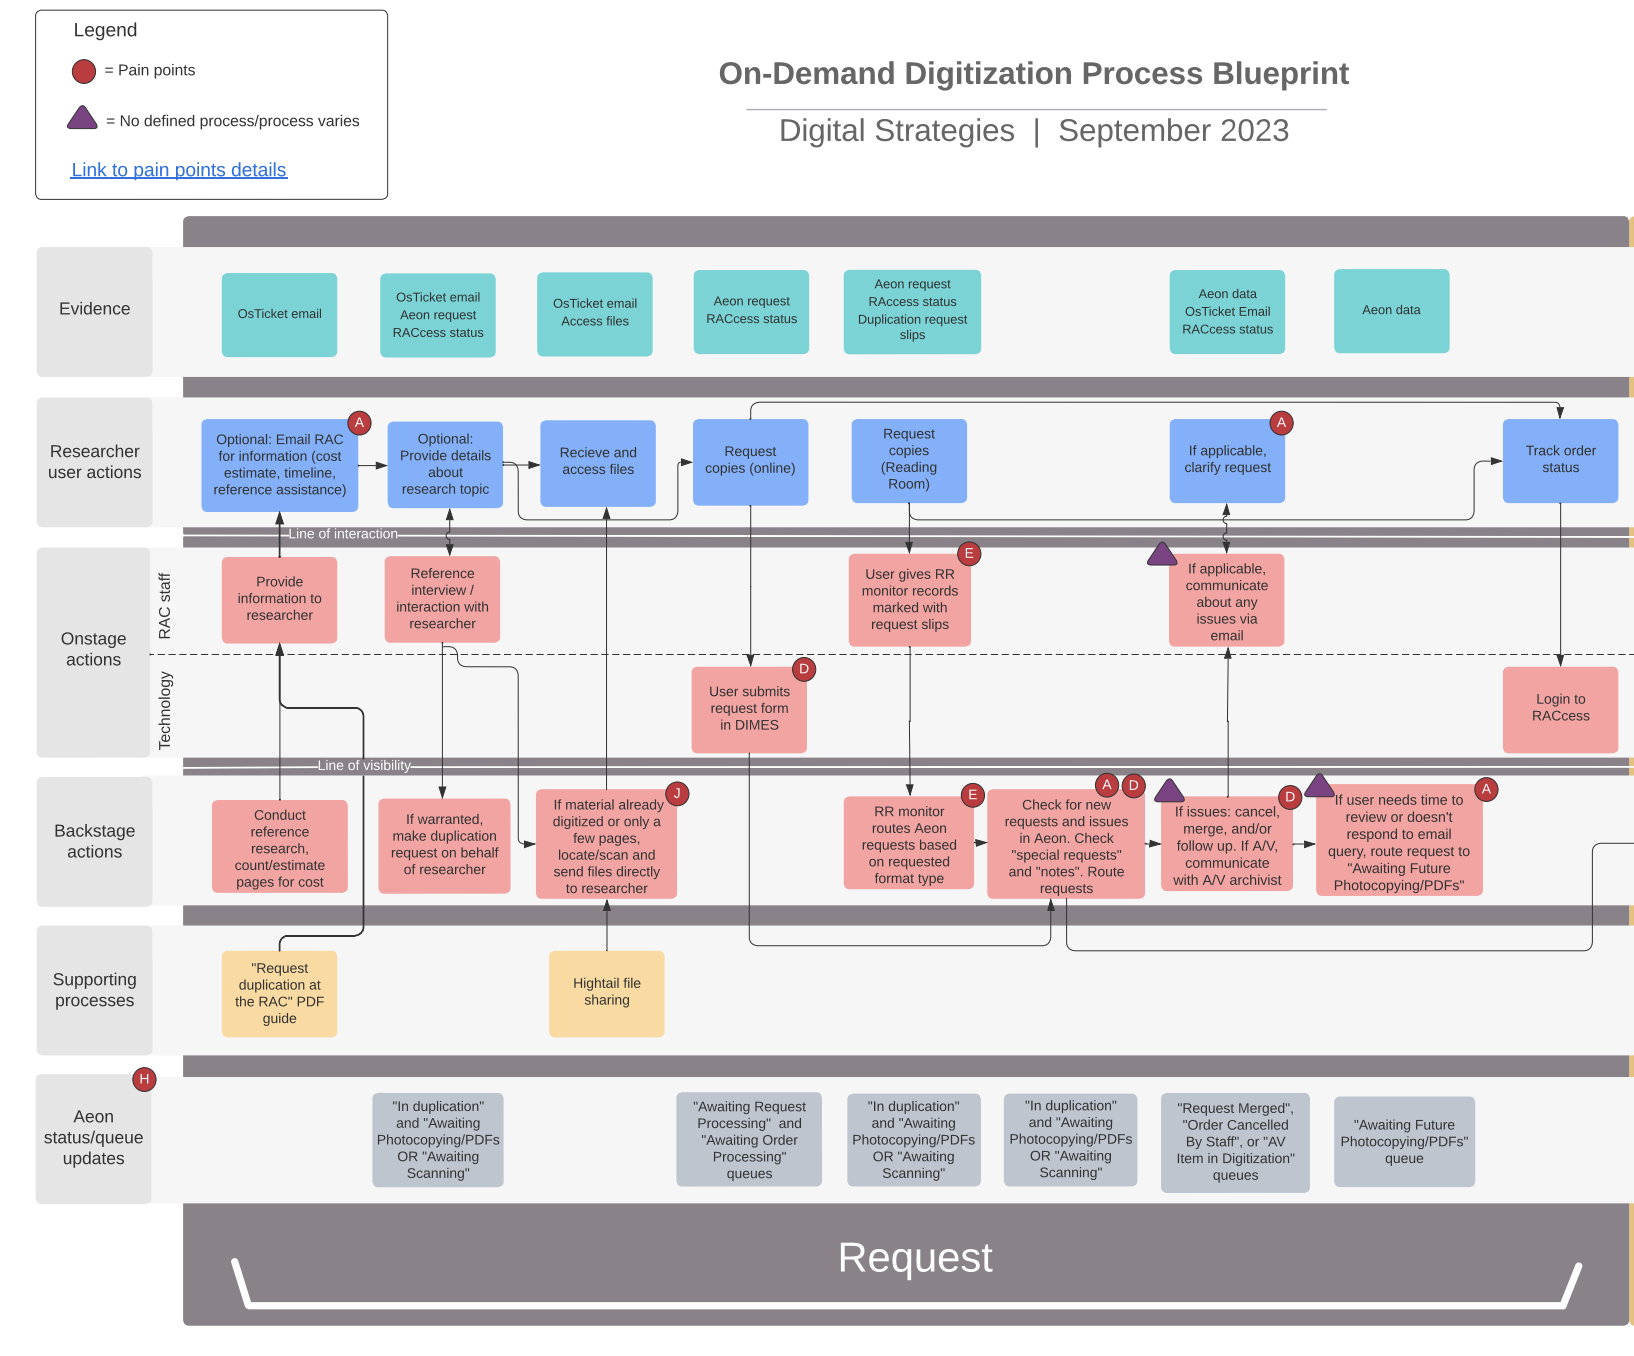
Service design tools and methods overlap with UX research and design tools including journey mapping, personas, user interviews, and various ideation activities, but also include specific tools to enable visualizing sequences and interactions using service blueprints and ecosystem mapping. The service blueprint is something we’ve made use of before at the RAC to understand complex processes like our audiovisual digitization workflows, reading room request and retrieval processes, and our IT ticketing system. While they can be complex to create and require substantial research and participant involvement, they can surface pain points and process inefficiencies very effectively and communicate a redesigned orchestration of complex processes as a design deliverable.
Applying service design methodologies
The first thing we did was give ourselves the gift of time knowing that (yes, I’ll say it again) applying solutions to unknown problems causes more problems in the future. We scoped out a 4-month research project with the goals to:
- Document current digitization processes and identify areas where processes were not defined.
- Identify the primary persistent problems and unmet needs in our digitization processes.
- Generate and evaluate ideas for digitization service (re)design.
- Produce a report with specific and actionable recommendations to improve staff UX and service sustainability.
We started by listening and understanding, brought in data and analysis, gave structure, sequence, and visual representation to gain process insights, and then moved to ideation and defining future strategy:
-
User interviews. As the project lead, I spoke to all RAC staff involved in digitization across multiple teams: 16 staff members. These stakeholders encompassed the full range of digitization activities including equipment and infrastructure maintenance, project management, vendor digitization coordination, reference services, billing/payment processing, surrogate file delivery to researchers, social media strategy, digital preservation, rights assignment, and the provision of long-term storage and access including via DIMES, our online discovery system. I structured and targeted my questions to learn about specific staff roles, details of their process and activities, and their feelings and perceived pain points associated with the process.
-
Data and documentation acquisition and analysis. I acquired data about digitization cost and revenue, fee models at other institutions, numbers of digitization requests completed and in the backlog, and equipment settings and configuration possibilities. I also gathered and reviewed existing digitization documentation. Finally, I noted what data we did not have that would be useful for project management purposes in the future.
-
Contextual inquiry. I connected with staff doing the work to observe specific processes. This was essential to see how people used equipment and systems and to better understand how people made sense of workflows and worked around known issues. It also enabled me to ask specific follow-up questions based on what I had learned from the stakeholder interviews.
-
Service blueprints. I created service blueprints detailing the current processes, as well as specific process pain points and areas where processes were not well defined, meaning people either had different understandings and approaches to these processes, or they were not being completed at all due to lack of definition.
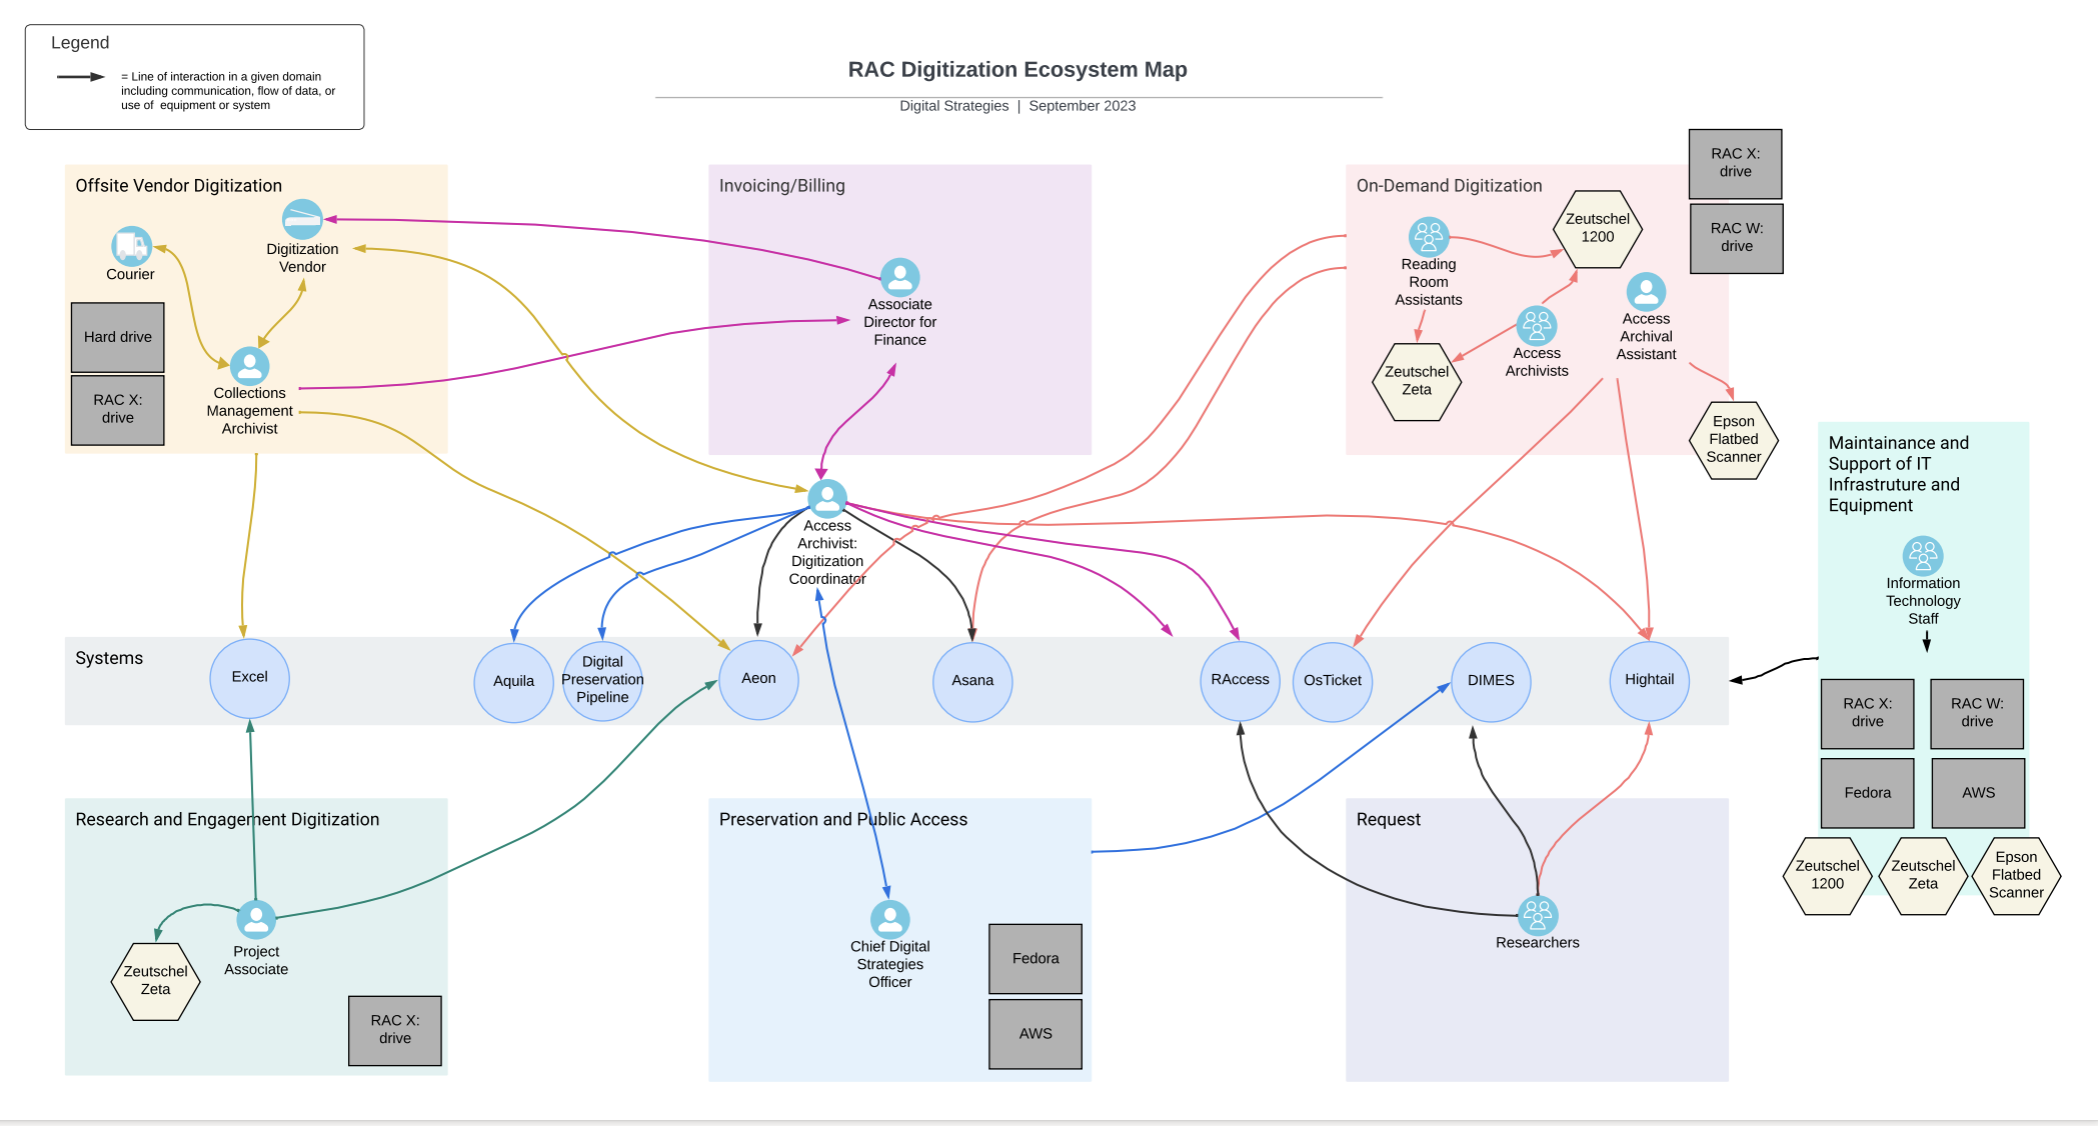
- Ecosystem mapping. To visualize staff roles and associated systems, I mapped process domains, associated roles and equipment, and technological systems, linking them with lines of interaction representing the flow of information, data, or use. This was admittedly spaghetti-esque, but revealed dependencies on systems and roles that helped us better understand touchpoints and potential process bottlenecks in a different way than the service blueprints.
-
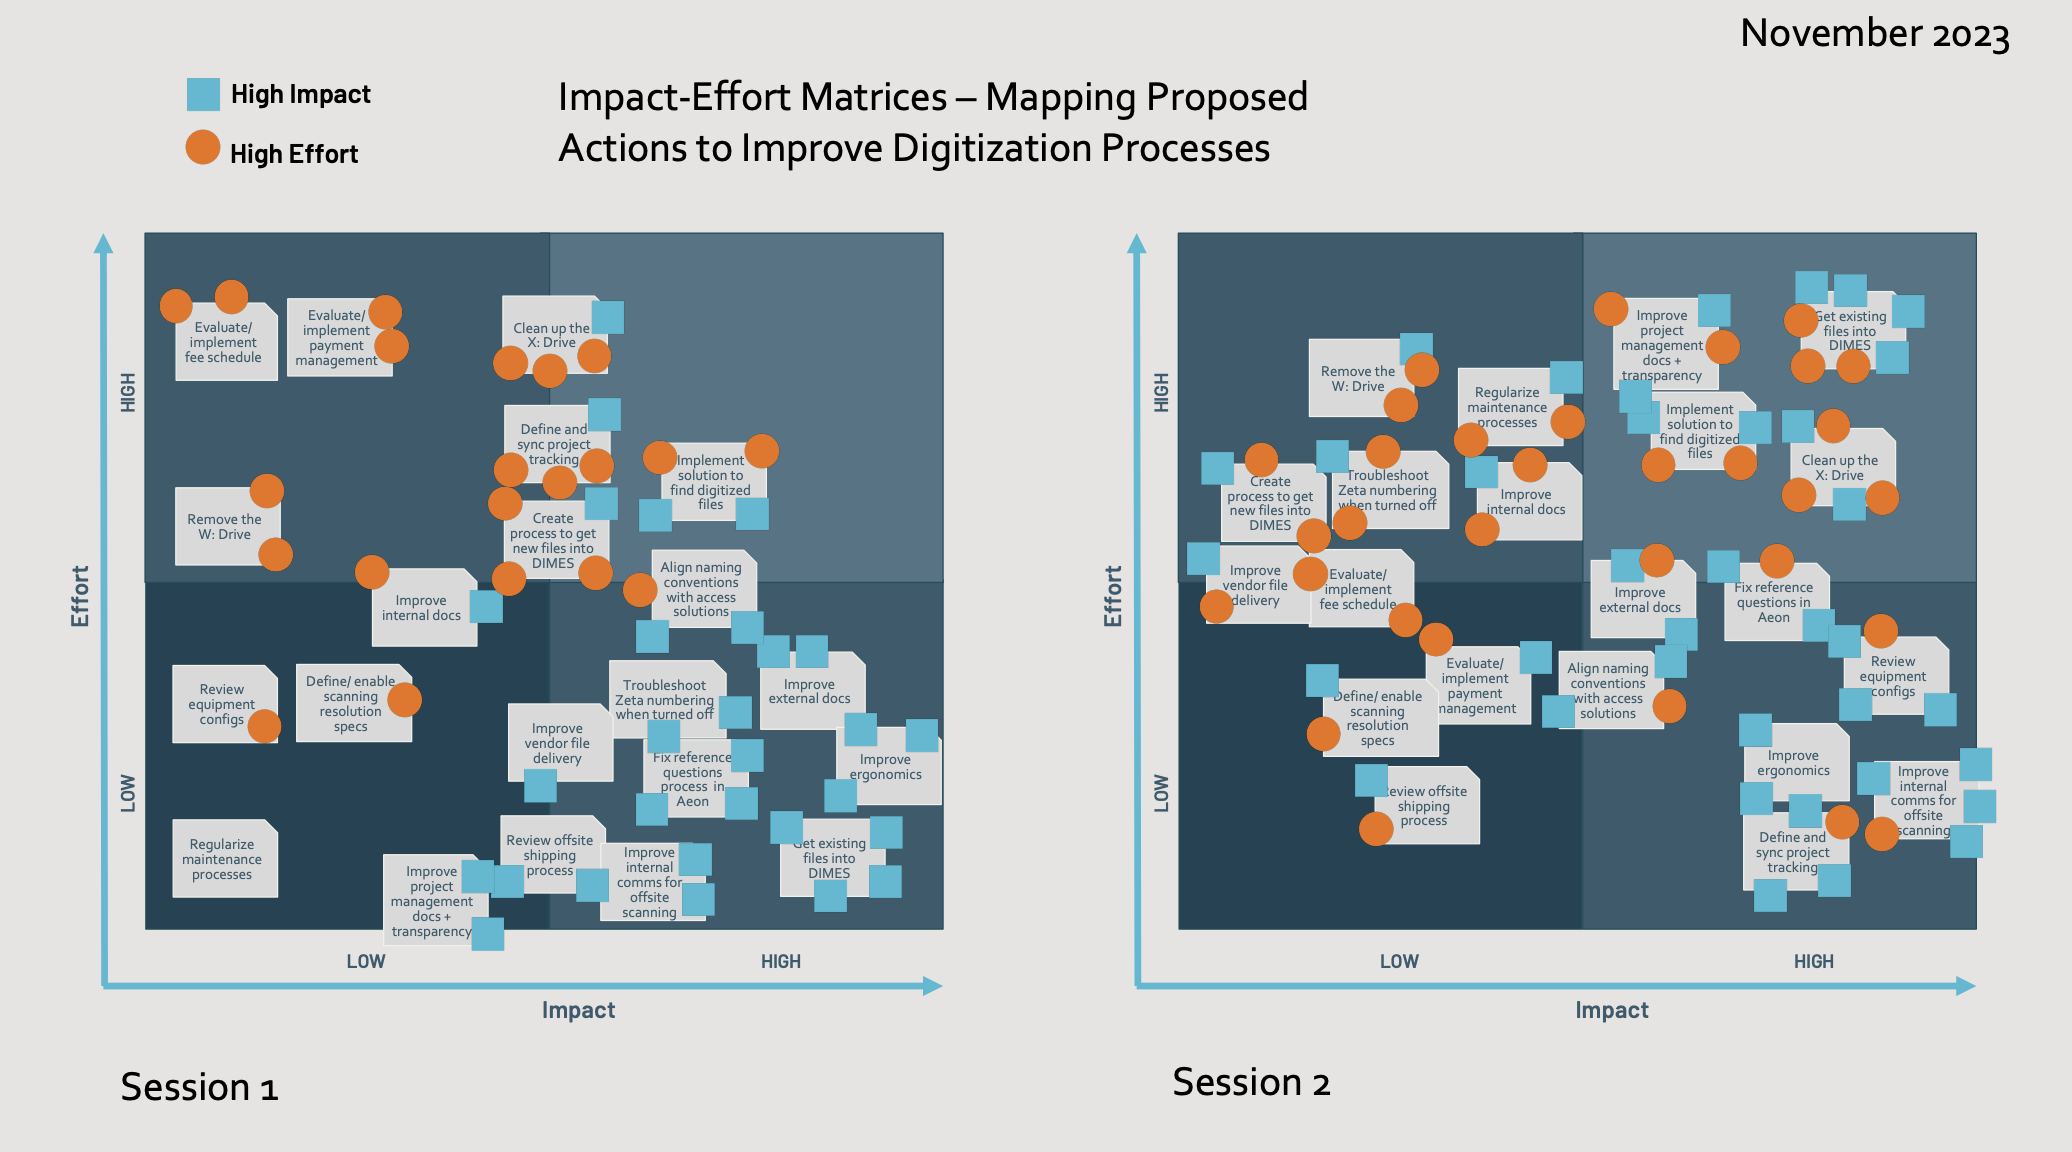
Development of proposed actions. After sharing the research artifacts with collaborators and stakeholders and receiving reactions, corrections, and feedback, I developed a set of proposed actions to address the pain points and process issues that we had surfaced in the research. These actions ranged in size and impact and were often projects in and of themselves. Some examples included evaluating alternative fee/no fee models for researcher digitization requests and implementing a new one, changing our directory/filenaming approach to better facilitate long-term access, and improving workstation ergonomics.
-
Impact/Effort matrix activity. To help refine and prioritize the proposed service improvement actions, the core project stakeholders participated in an activity to discuss and place these proposed actions on a graph of effort (y-axis) and impact (x-axis).
- Final report and recommendations. Finally, I synthesized our proposed next steps and what problems they would solve into a detailed report. We shared this report across the organization and to team managers to begin coordinating project planning and process improvements.
Now we understand the problems
Underlying all the proposed next steps detailed in the report were two key observations that this research revealed:
- Nobody understood our digitization processes end-to-end. Various staff have expertise in the tasks they are responsible for, but this lack of a comprehensive understanding and ownership over how actions and systems fit together to achieve defined goals means that we couldn’t think strategically as an organization about what we were doing and how we were doing it.
- There is a lack of observability of the process. We have not set up and/or maintained our systems and documentation to allow us to understand, manage, and analyze how things are working. This makes it difficult to understand where there are bottlenecks in the process, how long specific tasks take to complete, and to make informed decisions about resource allocation.
In future posts you’ll read more about the specifics of how we’re rethinking and changing our processes in response to what we learned to improve the researcher and digitization user experience, so stay tuned!