The Rockefeller Archive Center (RAC) has become increasingly aware of and concerned by the environmental impacts of climate change. We recently commissioned a carbon footprint study to better understand our emissions of greenhouse gases (GHGs). For the RAC, GHGs are tied to our energy usage. Developed in consultation with Climate Change & Environmental Services – a local firm that specializes in environmental inventories – this report creates a benchmark of our current energy usage and GHG emissions as well as a foundation for future action which can reduce our environmentally harmful emissions.
We’re also very aware that there is an ongoing conversation about the climate impacts of archives in our profession. Driven by individuals like Eira Tansey as well as groups like ProjectARCC and the DLF Climate Justice Working Group, this conversation has increasingly focused not only on the impacts of digital archives, but has also sought to look holistically at the ways in which archives both effect and are affected by climate change. Consequently, we felt it was important to provide some background on our RAC-specific study, with the hope that some of the takeaways are more generalizable and can help to move the conversation in the archival profession forward.
What is a Carbon Footprint Study?
Carbon Footprint Studies follow a specific methodology outlined by the World Resources Institute (WRI) and the World Business Council for Sustainable Development (WBCSD) in the Greenhouse Gas Protocol (or GHG Protocol), a suite of standards and tools specifically aimed at measuring emissions of greenhouse gases, such as carbon dioxide and methane.
These reports typically estimate emissions of GHGs in metric tons of CO2 equivalents (CO2e). This unit is calculated by multiplying the estimated emissions of different GHGs by their relative effects on trapping radiation, which is understood to be the basis of climate change. For example, methane emissions are accepted to be 28 times more potent as a trapper of radiation compared to CO2. Its emissions are therefore multiplied by 28 and added on to CO2 plus other GHGs multiplied by their relative potency to develop the emissions in CO2e.
The relevant WRI/WBCSD standard for us at the RAC – the Corporate Accounting and Reporting Standard – defines three “scopes” of greenhouse gas emissions to be measured: emissions from sources that we directly own or control (Scope 1); emissions from the generation of electricity we purchase (Scope 2); and any other indirect emissions (Scope 3).
Our report mostly covers Scope 1 and 2 activities, along with a few Scope 3 activities. Many businesses do not measure Scope 3 emissions because they are usually minor and sometimes hard to estimate. However, we chose to measure some relevant Scope 3 activities, such as transportation to our offsite storage location and employee commutation. The specific activities we measured were:
- Direct GHG emissions (Scope 1) from boilers and generators at the RAC, RAC-owned vehicles, and replacement of refrigerants.
- Indirect GHG emissions from electricity usage of RAC-owned or RAC-controlled operations (Scope 2)
- Indirect GHG emissions (Scope 3) from downstream transportation operations (offsite storage) and employee commutation.
At the advice of our consultant, we measured emissions for three separate years: 2016, 2018 and 2020. We chose these years specifically because we felt they would give us both a sense of any trends, while also accounting for any COVID-related anomalies.
What We Learned
First, the good. Overall, our energy usage and, thus, our GHG emissions have declined since 2016. Although some of this can potentially be attributed to the COVID-19 pandemic (more on that below) some reductions in energy use were evident even in 2018, before the pandemic. We surmise that these reductions are the result of several projects aimed at improving our facilities:
- In late 2017 through early 2018 we replaced around 20 old electrical panels throughout our campus with newer units which channel energy more efficiently.
- Also, in 2017 we completed a reconditioning of the tanks used to store #2 fuel oil, including removing years of sediment that had accumulated, which was causing pipes to clog, our boiler to malfunction and decreasing the efficiency with which heat was created and distributed.
- In 2019, we replaced the heating coil for two of our air conditioning units, which helped reduce the amount of refrigerant which had to be replaced.
- In 2020, we began to comprehensively replace fluorescent light bulbs with LED bulbs by retrofitting or replacing fixtures.
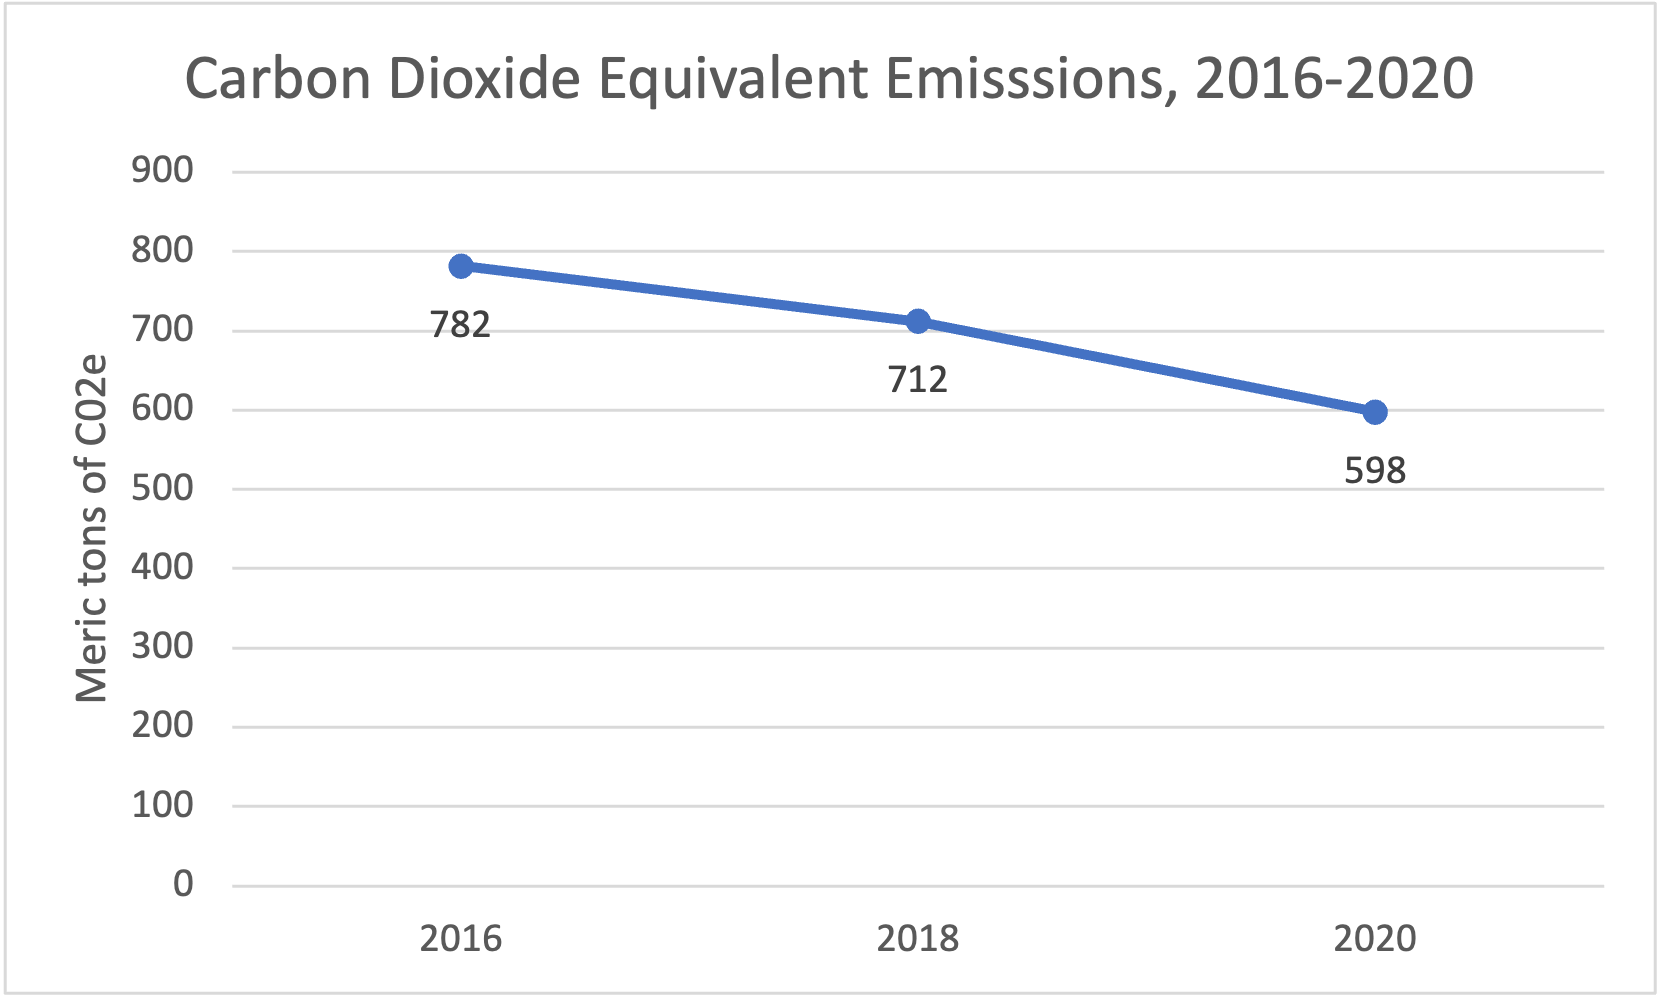
What is shown above are the RAC’s absolute emissions of GHGs. To put this in perspective, it is useful to develop more specific metrics related to the RAC’s operations. This is called “normalized” GHG emissions and allows comparison to other archives. For example, we can divide our absolute emissions by the square footage of our archival vault space to determine the GHG emissions per square foot of vault space per year. For example, dividing our absolute emissions in 2020 (598 metric tons of CO2e) by the total area of our vaults (21,000 square feet) we can see that our GHG emissions are 0.028 metric tons of CO2e per square foot of vault space per year.
In terms of analyzing the source of the RAC’s overall GHGs profile, it is clear that there are two main sources of emissions: climate control (specifically heating/cooling) and IT infrastructure.
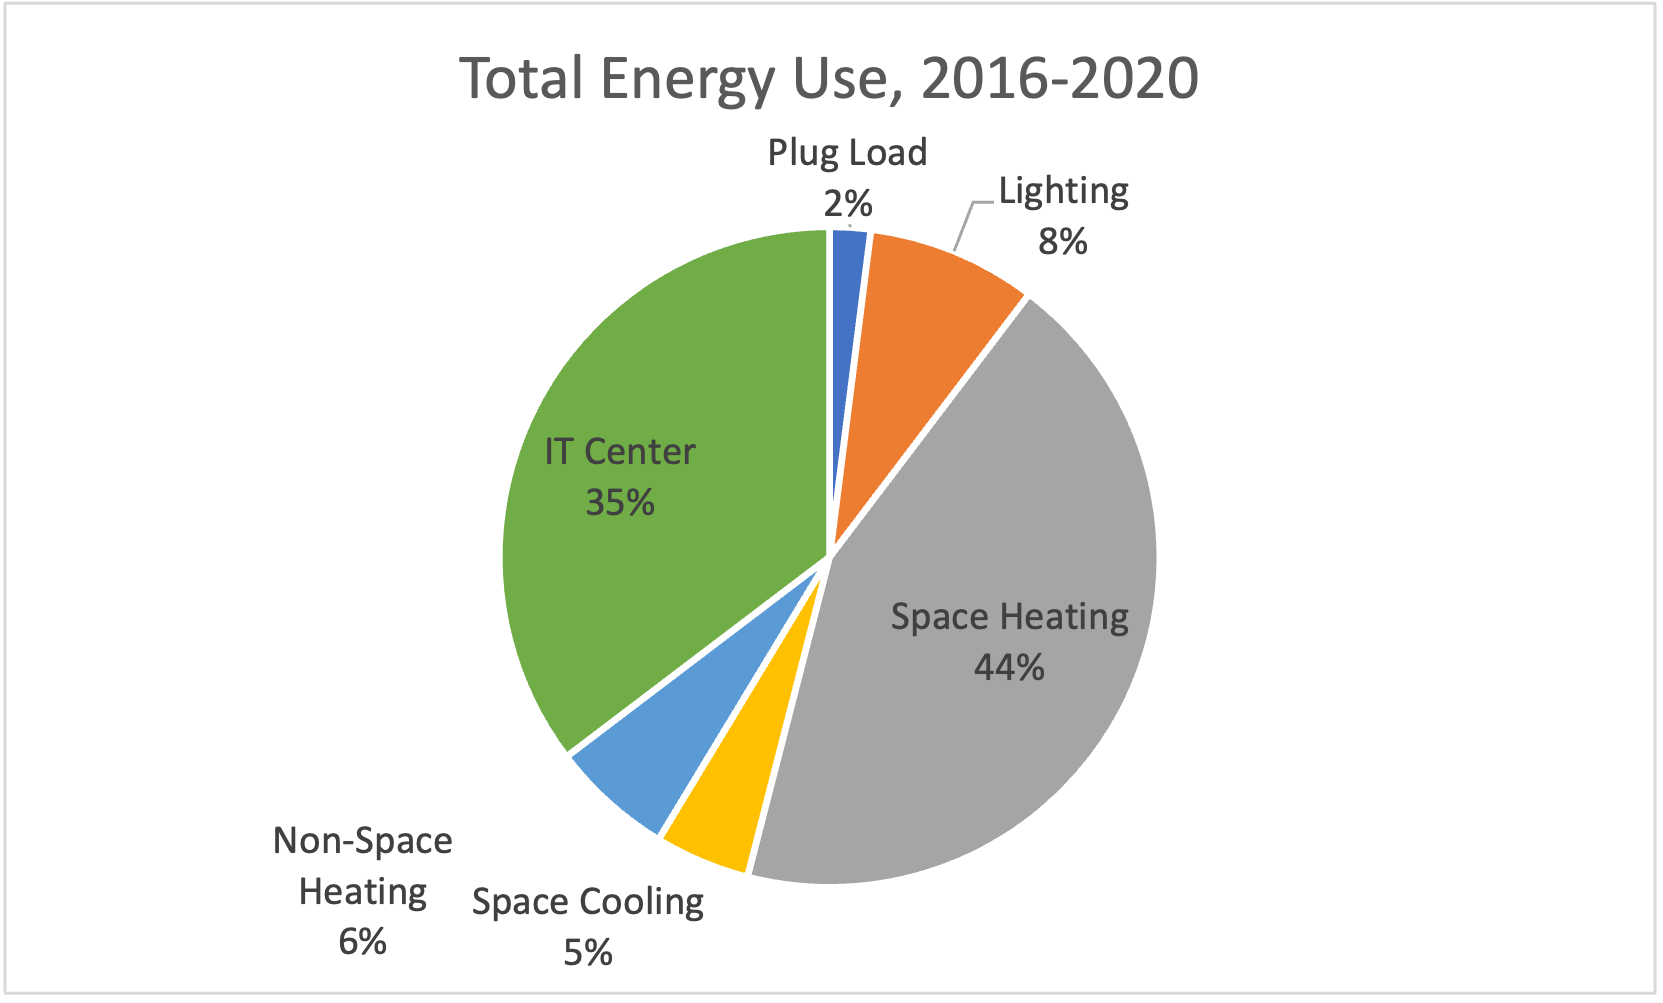
A critical factor in the high GHG emissions from space heating is that the RAC must combust #2 fuel oil in our furnaces as there is no availability of natural gas (which emits fewer GHGs) in the area. Because we have limited options for how heat can be generated, energy savings in this area are going to be driven by how efficiently we are able to distribute or transport it once it has been created. As we’ve already seen, replacing or updating equipment can have a huge impact on the efficiency of energy transport.
The percentage of electricity we use for technology-related activities was revealing to all of us. It’s also worth noting that not only has IT-related energy usage increased while all other areas of energy usage have declined, but also that this figure doesn’t account for emissions produced by cloud services, which are an increasingly significant factor in our IT environment. So, our actual technology-related energy consumption is likely significantly higher than what is represented in this study.
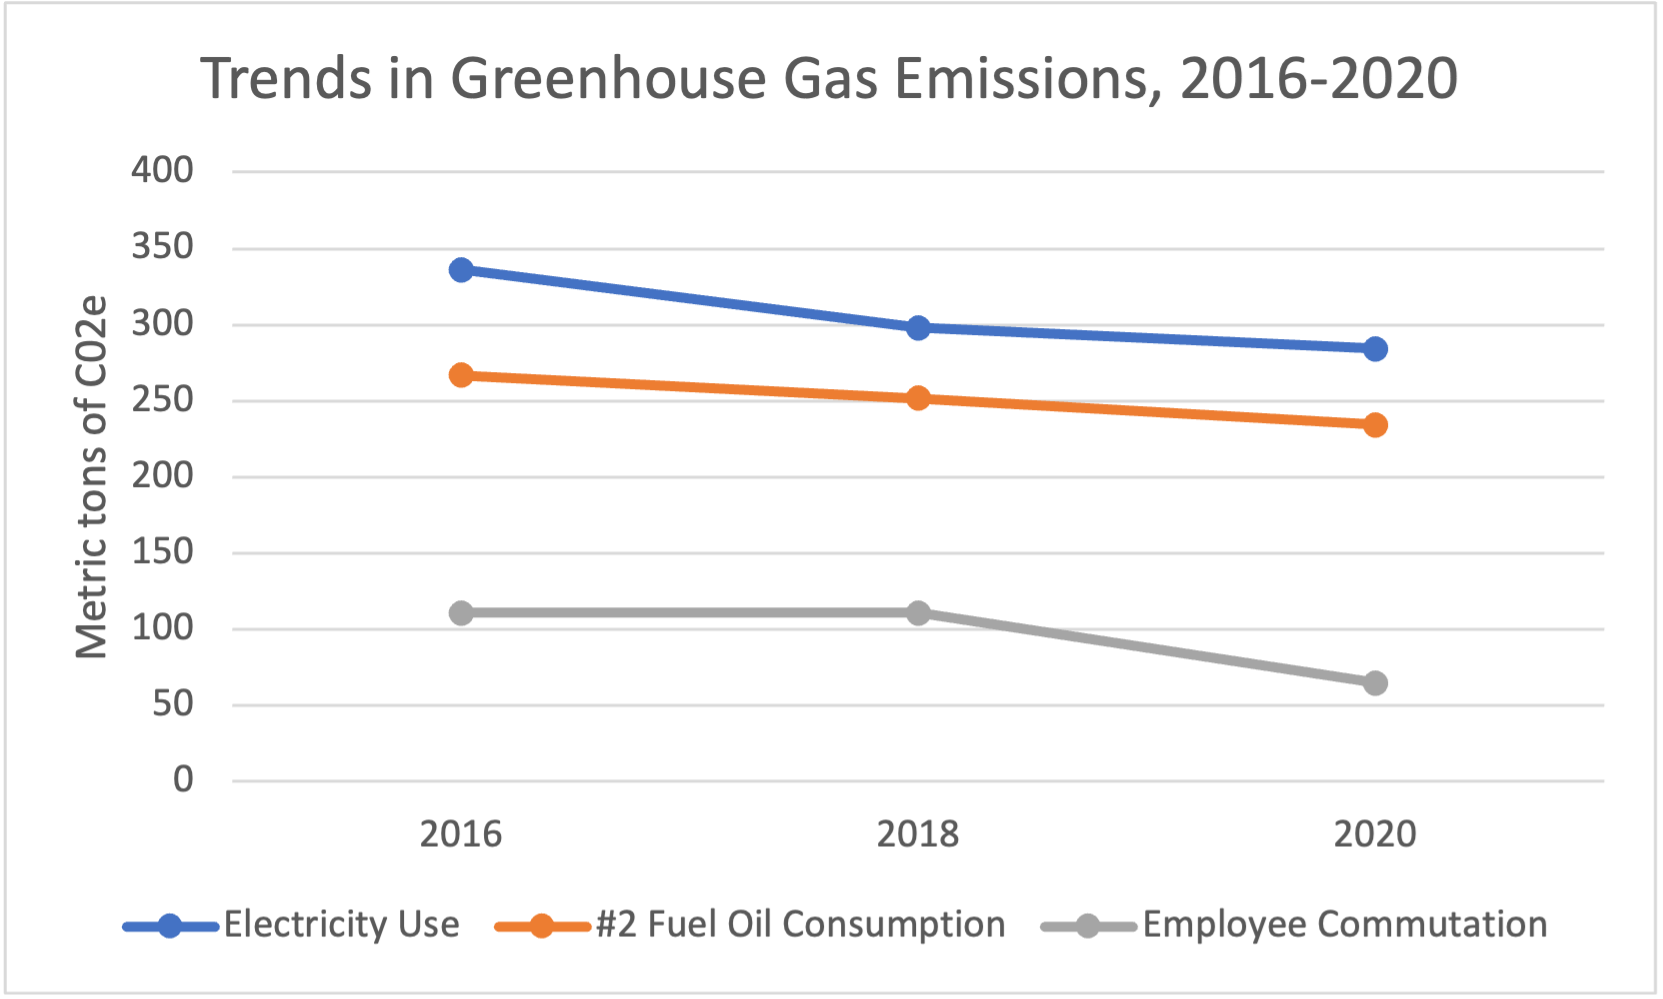
Finally, the COVID-19 pandemic did not have a significant effect on our overall energy usage and GHG emissions. This may appear surprising given that the RAC was fully remote for much longer than many other archives; we went fully remote in March 2020 and didn’t systematically return to work until March 2022. During that period, we certainly saw a dip in emissions from employee commutation, however the overall impact on our carbon footprint is relatively small (around 60 metric tons of CO2/year). Our electricity usage and heating fuel consumption were not significantly impacted by the pandemic, however, because space heating and cooling had to be fully maintained in the vaults and throughout the buildings in order to prevent mold buildup or other harmful effects. Additionally, IT services had to be fully maintained throughout the pandemic.
One more item to consider is the quality (in terms of GHG emissions) of the electricity that the RAC uses. Currently, the electricity in the grid serving the Westchester County area is produced approximately 22% from renewable sources. It is possible for us to contract electricity that is 100% renewable and, thus, the same electricity usage would result in lower GHG emissions and a reduced carbon footprint.
What’s Next
As mentioned at the outset, this report is just the beginning. Going forward, we will explore other ways to reduce greenhouse gas emissions in our physical environment, such as producing solar energy, upgrading to LED lighting (which is significantly more energy efficient), replacing older equipment with more energy efficient equivalents, and as mentioned above, contracting cleaner electricity.
It is also clear we need to better understand our IT energy use, so we have an accurate picture of the emissions produced by our technical infrastructure and can start strategizing about how to reduce them. We will be looking to do an IT-focused study soon to give us this baseline, and you can expect us to publish findings from that report and actions we will be taking to reduce our climate impact once we have identified them.
We’d also be very interested in hearing from other archives who have completed a similar study. What trends are you seeing? Are our GHG emission profiles similar or different, and if so in what ways? How can we work together to collectively decrease our climate impact?