Since September 2012, when we first launched DIMES, we’ve been using a variety of methods to gather data on where our users come from, what they look at on DIMES, what functionality they use, and what kinds of things they search for. Looking at this data over time gives us valuable into how users are actually interacting with DIMES, and helps us evaluate the system’s functionality as well as the description of our collections.
Demographics
Web analytics give us vital demographic information including the countries or regions of our users, the languages they speak, and how many new and returning users are visiting the site. It can also tell us about the technology with which users access DIMES: the speed of their internet connection; the browser they’re using; the operating system of their computer; and whether they’re on a desktop computer, a tablet or a phone. These things matter a lot when we think about the use of language in our finding aids, the amount of data the system tries to load at a time, and what information is displayed on different sized screens.
We also gather information on the source of traffic to our website: from a search engine; a link from another site; or directly from a user typing in the website’s URL in their browser’s address bar. Here you can see a breakdown of those sources for the last year.
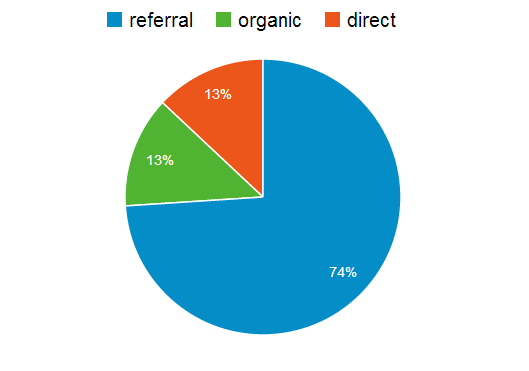
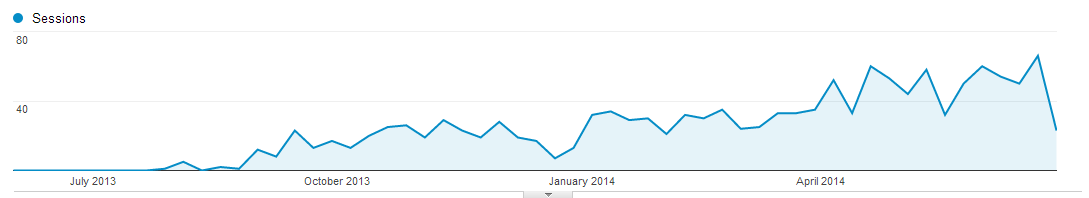
Detailed information on referring sites helps us evaluate our participation in consortia - we regularly get hits from consortia we participate in, such as ArchiveGrid or the National Library of Medicine - as well as the degree to which projects like the RF Centennial website drive traffic to DIMES. Search traffic tells us both how many people are finding our site via search engines (I talked about improving those numbers in a series of earlier posts) and also the relevance of search terms which lead users to our site. As you can see, over the past year the number of visits to DIMES from web search engines like Google has grown pretty dramatically:
Content
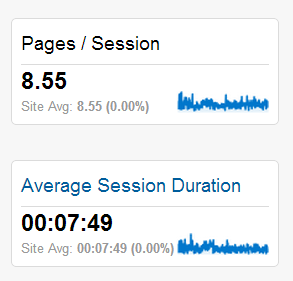
In addition, we gather statistics related to the content on DIMES, including general information on how long people stay on our site and how many pages they view during a visit. Although one might assume that it would be better for users to spend longer amounts of time on our site, that’s not necessarily true for DIMES, since the purpose of the site is to provide information regarding collections to users as quickly as possible. A shorter visit time might indicate that a user was able to quickly find the information they need, while a long visit with lots of page views might indicate a frustrated user unable to find the information they need. Here’s what the average number of pages per session (analytics-speak for a website visit) and duration of session for the past year look like:
Information about which pages are accessed most often, including which finding aids are most viewed, can help us decide which collections we want to improve description for, as well as what collections are likely to be most requested in the reading room.
We also collect data on the last page a user looks at before leaving the site, referred to in web analytics jargon as an exit page. This can help us understand what drives users to leave our site: if they’re leaving from a search results page, they might be overwhelmed by the volume of search results; if they leave from a Bookbag page, they likely successfully sent themselves an email of materials they want to view.
Events
Another category of information we gather through web analytics are specific user interactions with DIMES, for example clicking on a button or selecting an option in a menu. Tracking these events gives us some very important insights into the ways users interact with specific functionality, helps us assess the success of newly implemented features and exposes gaps or flaws in system functionality.
For example, we tracked the number of clicks on the “Find similar items” feature that used to be part of the search results. We discovered that, while there were a number of clicks on the initial link to show these similar results, there were almost no clicks on any of the links to similar results. This told us that this feature was not very helpful to users, so we removed it.
Similarly, tracking clicks on links to digital objects tells us both how often our users are looking at those objects, but also in what context (search results or container list) our users are clicking on those links.
Perhaps some of the most valuable information provided by event tracking is a window into how users search using DIMES. Not only can we track numbers of different kinds of searches (a simple keyword search, an advanced keyword search, or a browse) but we can also tell from which page that search took place. In case you’re wondering, most of our non-staff users do simple keyword searches, and the overwhelming majority of those searches are done from a search results page rather than the home page. This data also tells us which sets of facet terms users are clicking on most often, which helps us think about the order in which they should appear.
Search Terms
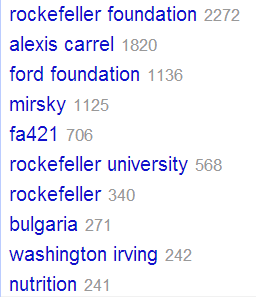
Lastly, with a bit of additional legwork we can also find out which search terms are being used frequently on DIMES. In order to do this we have to extract data from Apache log files, and cluster similar concepts together using Open Refine.
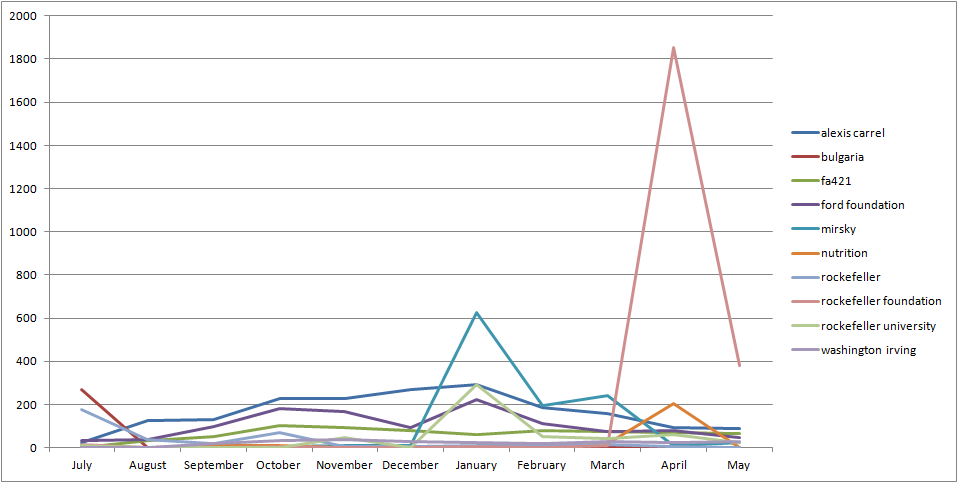
Here are the top search terms from the past year:
And here you can see the frequency with which these terms were searched over time:
As you can imagine, this data is incredibly valuable in helping us think about what are users are searching for, and whether or not they’ll find it in DIMES. It can also help us come up with strategies to improve our description, so that particular keyword terms or structured data are present in our finding aids.
The data we are able to gather from DIMES gives us both a broad statistical overview of the use of DIMES as well as very detailed information about user interaction with particular functionality. Combined this data with in-person user testing, we are able to better understand our users goals and behaviors, and improve DIMES to better match those needs and activities.